Using data science for social good

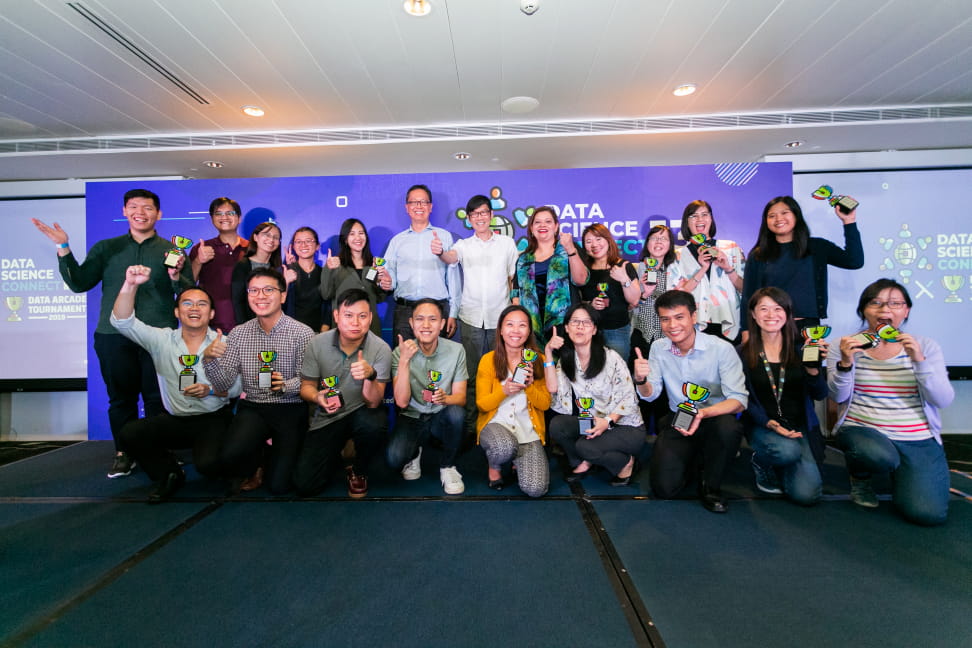
Hundreds of public officers took part in the Data Arcade Tournament 2019, the second year running of the visual analytics competition within the Singapore Public Service.
The competition concluded with a 5-hour live hackathon with finalist teams presenting their insights that could promote volunteerism and philanthropy in Singapore.
A picture says a thousand words. This is indeed true with visual analytics. Rather than overwhelm our audience with paragraphs of text and tables with multiple rows and columns, visual analytics allows us to tell our stories and convey our key points clearly and concisely. Visual analytics can be used in many different ways – to explore the data, understand trends and simulate the impact of changes in policy parameters, monitor key performance indicators in real-time, or keep track of service standards, etc.
The Data Arcade Tournament is an annual public sector visual analytics competition organised by the Data Science and Artificial Intelligence Division (DSAID) of the Government Technology Agency of Singapore (GovTech). Believing that visual analytics is not difficult to learn and use, the Tournament is meant to encourage more public officers to start harnessing the power of data and applying data science knowledge in their daily work. Workshops were provided for officers who were new to visual analytics, while experienced officers were encouraged to explore new datasets and convey their insights in a coherent data story. The strong participation was very encouraging. Some 600 public officers from 63 agencies formed 144 teams at this year’s Data Arcade Tournament.
The Tournament had two rounds. The preliminary round was held between 12 July to 30 September 2019. Tournament participants chose between two data analytics platforms —Qlik Sense and Tableau Desktop. They were allowed to choose their own open datasets. Out of the 144 teams, the top six teams (three using Qlik Sense and three using Tableau Desktop) qualified for the final round held on 4 November 2019. All finalist teams were given the same dataset only on the competition day itself. They had to process the data and construct their data stories during a 5-hour Live Hackathon, akin to an Iron Chef competition where the key ingredient is revealed only on the spot.
This year, the National Volunteer and Philanthropy Centre (NVPC) kindly provided the dataset for the finals using anonymised data drawn from the portal Giving SG. The teams were encouraged to find insights on how NVPC could grow the pool of donors and volunteers and how to keep them more active.
TechNews caught up with the winning teams from the Land Transport Authority (LTA) and Ministry of Manpower (MOM) to learn about the insights they gleaned from the datasets and the lessons they learned from using the visual analytics platforms.
Causes that matter
One key judging criterion was whether the teams' analyses produced actionable outcomes. In this respect, the teams did not disappoint, making several interesting observations by sifting through records on donor activities and contributions.
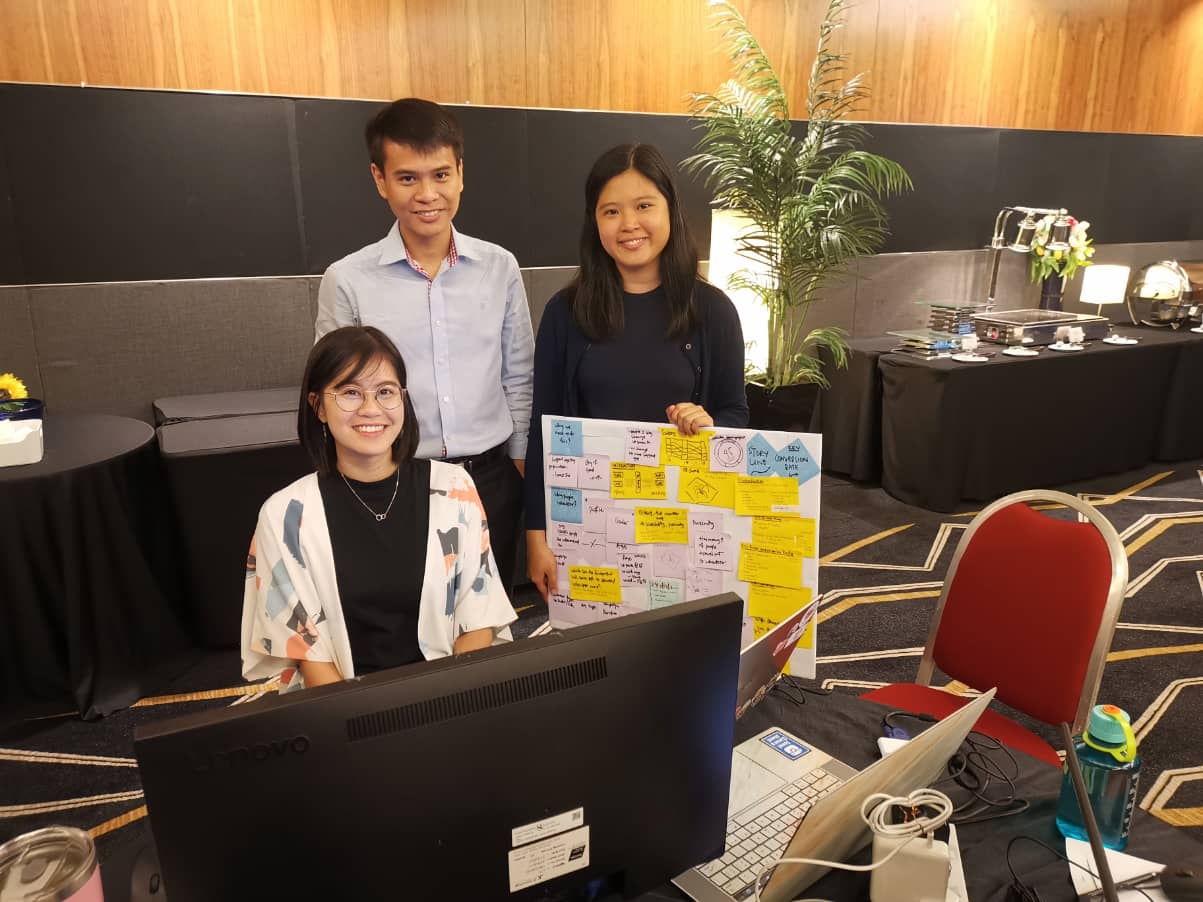
A team of three data analysts and scientist from LTA did an analysis on the distance of travel to explore if this affected users’ decision to volunteer. “We found that people were still willing to go the extra mile for the causes they believe in,” said Ms Rachel Lim, a member of the LTA team, which emerged as the overall winner among the users of Tableau. On the same note, NVPC is also looking to push out location-based volunteerism in its pipeline to encourage more volunteers to step up.
When asked about the most challenging aspect of the competition, Ms Wang Hui Xian, also from the LTA team, said that the lack of time had restricted the depth of the analysis they could conduct. Nonetheless, there may be opportunities to explore that depth further, as Ms Wang noted that NVPC has expressed interest in collaborating with her team in the future.

(From Left) Wang Huixian, Cheo Rui Ming, Rachel Lim
Many drops make an ocean
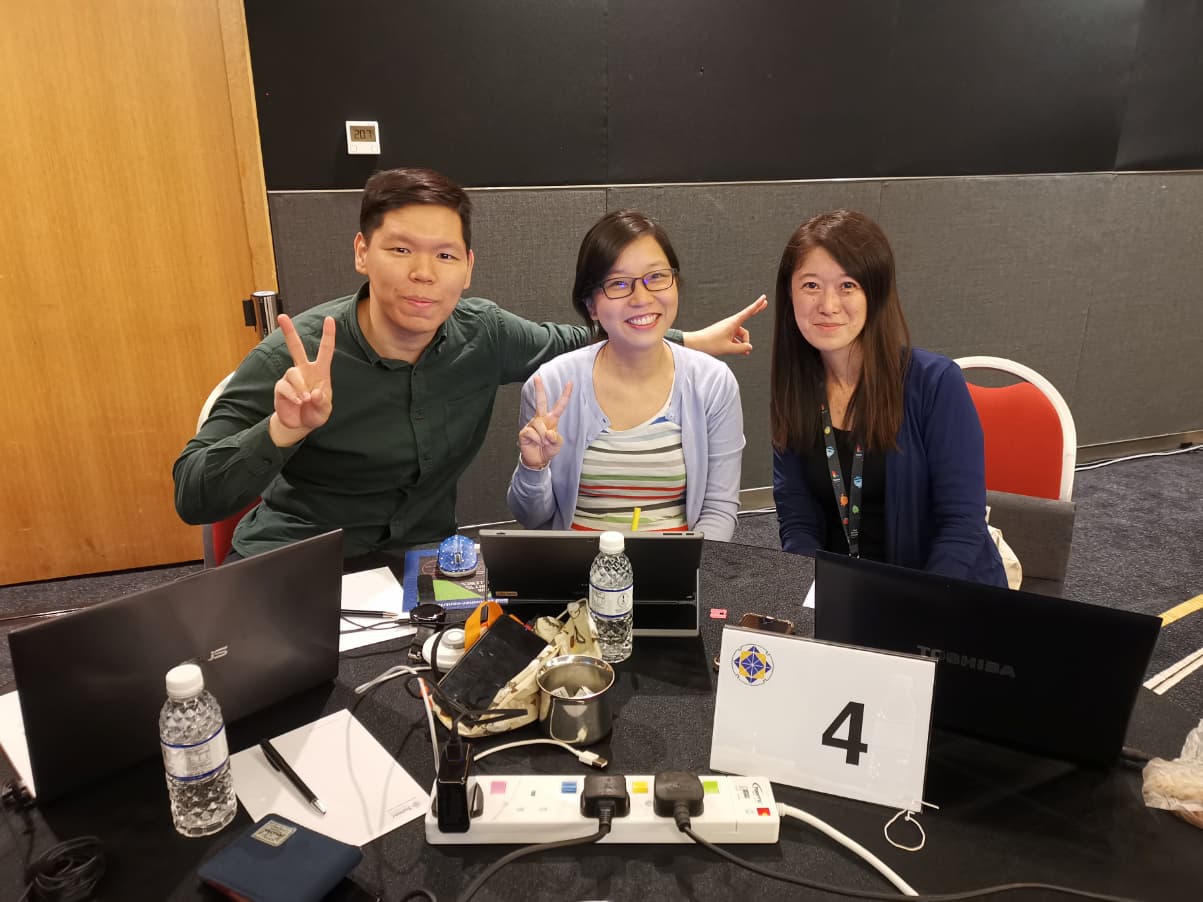
Meanwhile, among the users of Qlik Sense, the team from MOM clinched the top prize for their analysis of the conversion rates among new, former, and long-term donors. In their presentation, the team made recommendations on areas that NVPC could examine to encourage more long-term donors to stay on this journey of giving.
The team also noted that smaller donations accounted for the majority of the total donations received by NVPC. “A message we want to bring across is that it is okay to donate very little, and it is okay to start small. Every bit of donation adds up in the end,” said Ms Madeleine Sim, a member of the MOM team.
Ms Ruth Lee, another member of the MOM team, said that they would use the experience from the Data Arcade Tournament to delve deeper and explore the capabilities of data visualisation in their work. “We may explore data visualisation as part of the data literacy programme we have been developing at MOM to empower others to use and work with data more efficiently,” said Ms Lee.

(From Left) Benjamin Aw, Madeleine Sim, Ruth Lee
Empowered by data
Calling the event a success, guest-of-honour Mr Ng Chee Khern, Permanent Secretary (Smart Nation and Digital Government), lauded the teams and reiterated the importance of data in Singapore’s digital transformation efforts.
“With the same dataset, the six teams analysed the issues in many different ways and arrived at many interesting conclusions,” he said. “I hope that this event has inspired us all to deepen our knowledge in visual analytics and to charge ahead in our data science journey, as we need everyone to work together to transform the public service into one that is digital and data-driven to the core.”
All participants of the Data Arcade Tournament received extended trial use of the respective analytics tools for the purpose of the Tournament. Grand prizes for the winners include overseas conference tickets for the Qlik and Tableau conferences to broaden their horizons on the potential of visual analytics.

